8/25 – 12/25
The objective of this research project is to analyze how osteoderms on an alligator can effect wake signatures in the surrounding fluid.
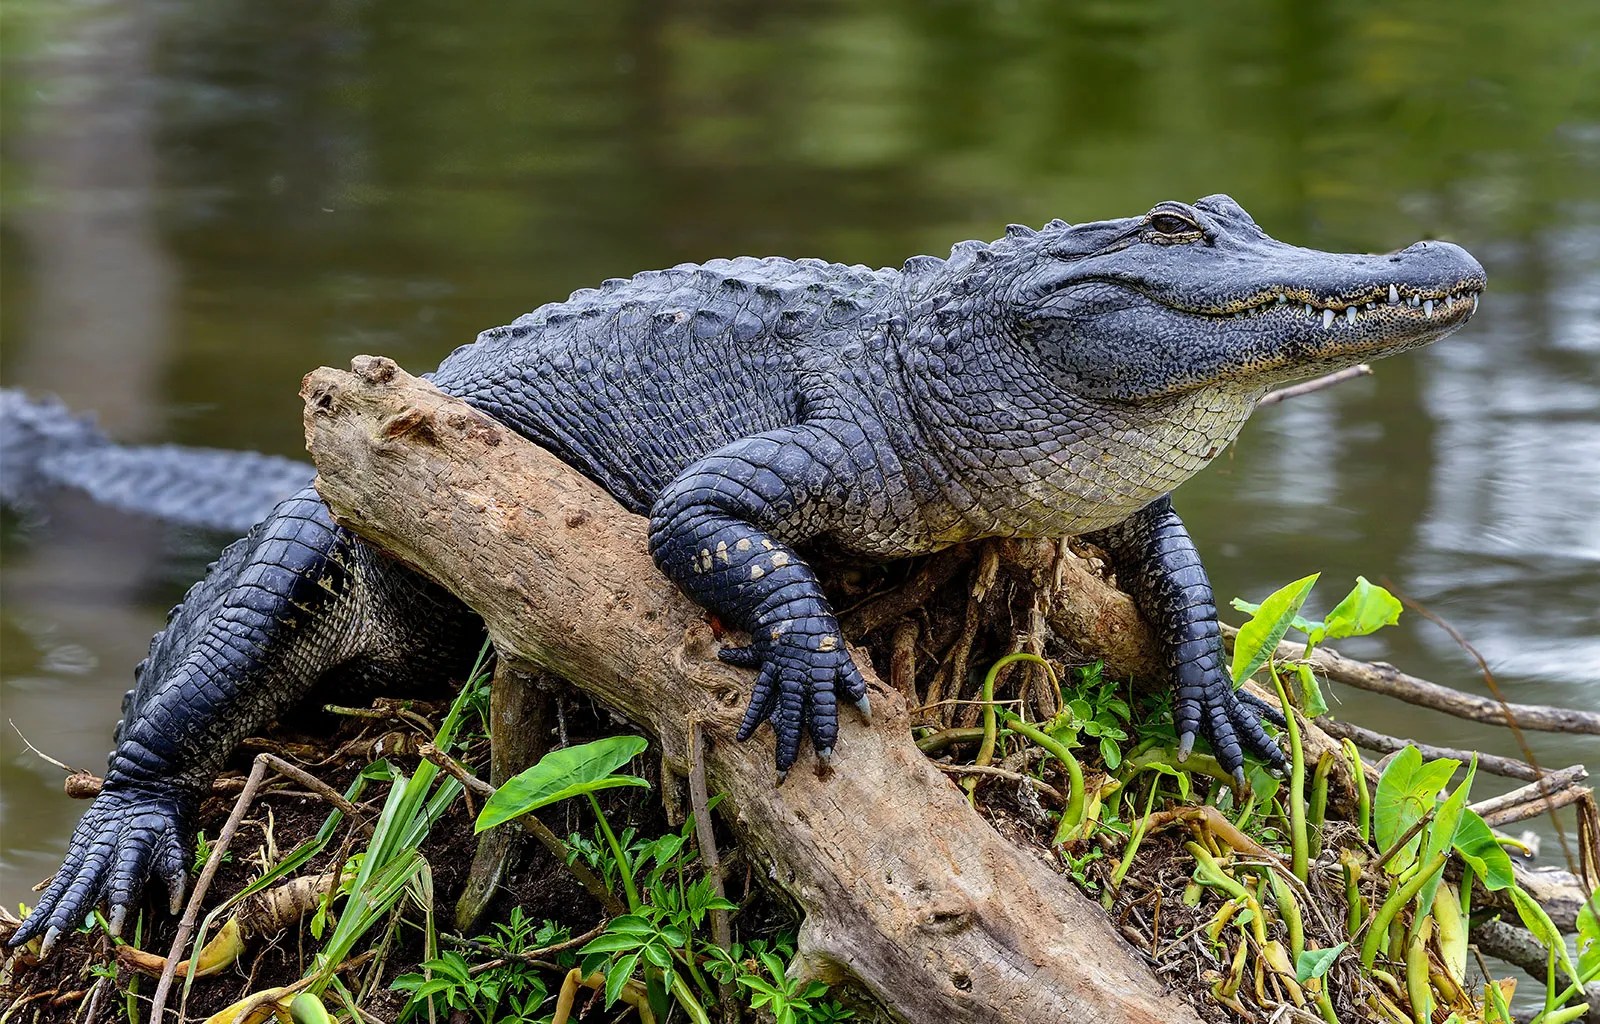
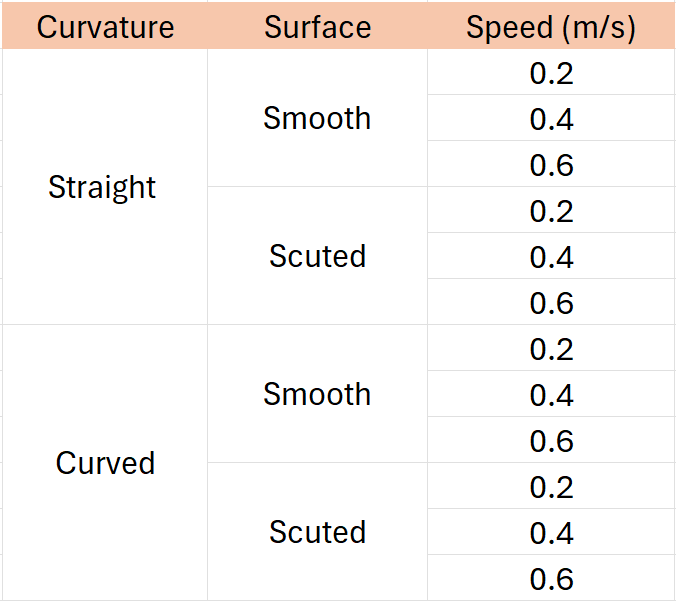
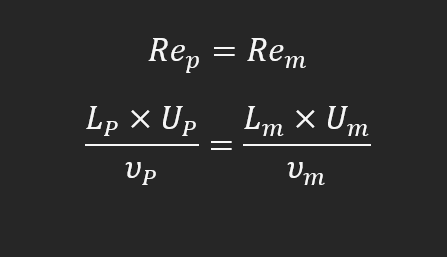
For this project I took the responsibly of being team lead. Our team first began by designing our experimental arrangements. We decided to utilize a water tunnel in the basement of the Advanced Technology Research Center at Oklahoma State University for our tests. For our test conditions, we chose to make 4 models. A test condition matrix is shown to the left. We planned on making two curved models and two straight models. For both pairs, there was to be a tail with and without osteoderms. The tails would be pulled by a towing tank and the velocity would be varied while the wake signature is captured with Particle Image Velocimetry (PIV). Next we began prototyping. My team studied the morphology of alligator tails. A length, width, and height scale was set using ImageJ software and pictures of real alligators with known lengths. After the geometric scale was set, we worked on the dynamic scale. We studied the Reynolds number range that alligators operate in by using a paper by Frank E. Fish [1]. It was found that an acceptable Reynolds number range for alligators is 6.1 * 10^4 to 4.5 *10^5 . Using the equation in figure 2, we were able to select a model length and a test speed for our model to accurately match the realistic Reynolds range. Our model was 60 centimeter long and to be tested at speeds of 0.2 m/s, 0.4 m/s, and 0.6 m/s.
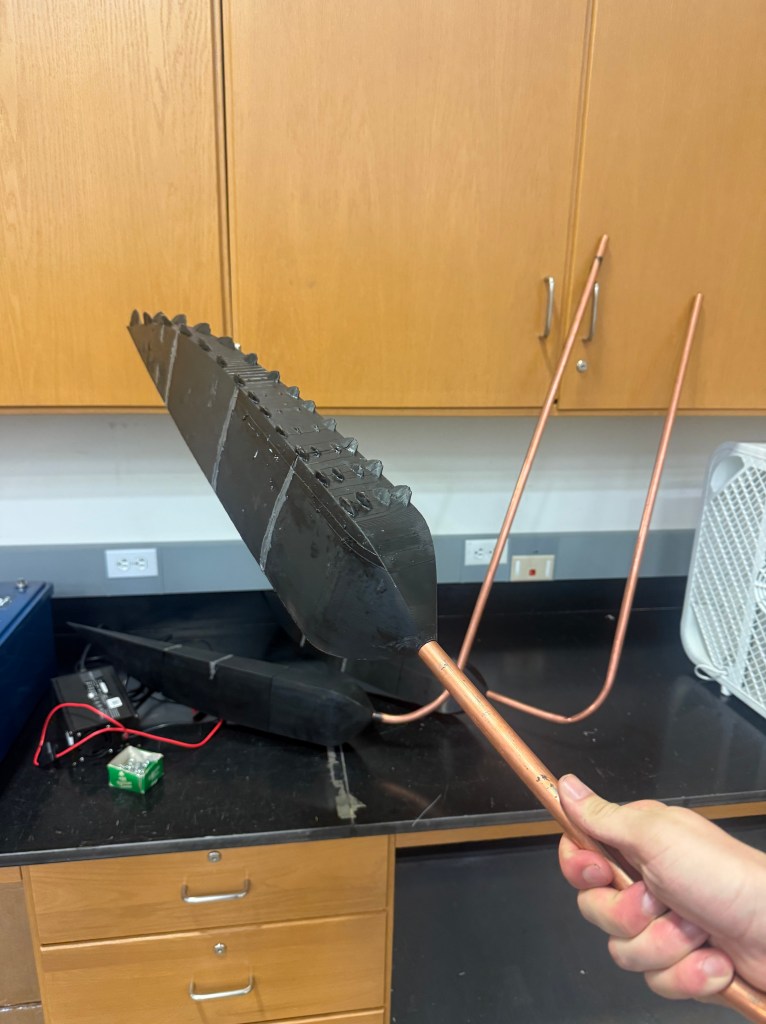
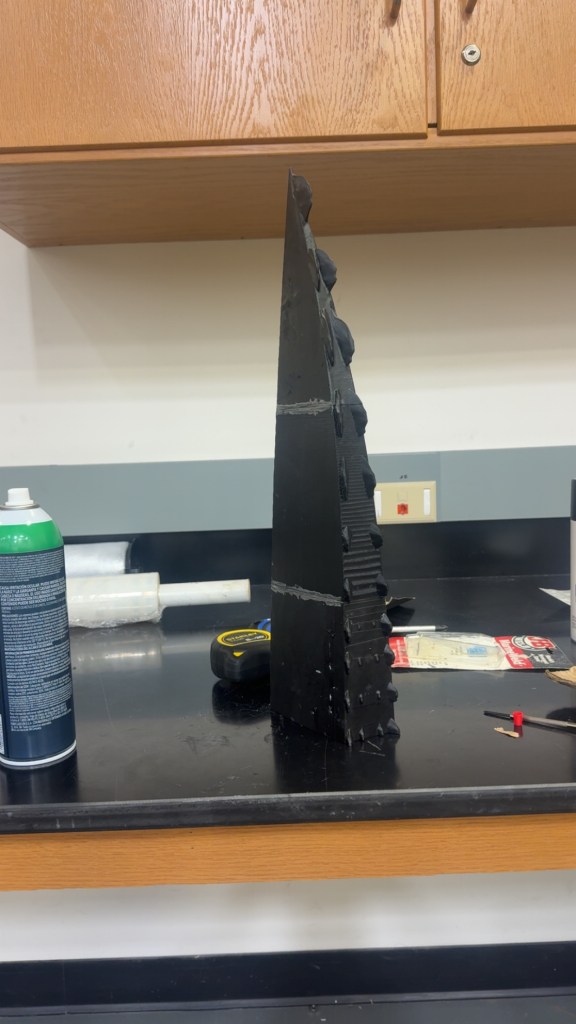
Our tail was printed using FDM 3D printers in Endeavor at Oklahoma State University. ABS was used as our filament due to its increased strength and water resistance. Due to the length of our model, it was printed in sections which were then fixed together on a copper pole using epoxy.
Testing
After getting the models all assembled, we began testing. Models were fixed to a copper pipe which was bent at a 90 degree angle and attached to a towing carriage in a water tank The water within the tank was filled with tracer particles. Next, a laser sheet was aligned with our model in order to utilize PIV flow visualization. The way this works is the laser excites the tracer particles while a high speed camera takes pictures of the flow. The result is a large amount of pictures that show excited particles and how they move frame-by-frame. Using this as well as MATLAB, data analysis was conducted.
